Introduction to Uptime Kuma
Uptime Kuma is an innovative self-hosted status monitoring solution designed to provide users with pivotal insights into the uptime and performance of their websites and network services. As an open-source project, it facilitates organizations in monitoring their digital assets reliably and effectively. Unlike many conventional monitoring tools, Uptime Kuma can be set up on personal servers, granting users complete control over their data and configuration, which is crucial in today’s digital landscape.
One of the primary features of Uptime Kuma is its ability to track website uptime. Users can receive real-time updates on the operational status of their websites, helping them promptly detect outages or performance issues. This functionality is essential for businesses that rely on their online presence, as prolonged downtimes can significantly impact customer satisfaction and revenue.
Another key aspect of Uptime Kuma is its versatility in monitoring network services. This feature enables users to keep an eye on a variety of services, such as HTTP, HTTPS, TCP, and ICMP, among others. By doing so, Uptime Kuma enhances the capacity to ensure that all components of the network infrastructure function correctly, contributing to overall system reliability.
Additionally, Uptime Kuma offers notification features, which alert users via various communication channels when a service disruption occurs. This proactive approach allows businesses and network administrators to take immediate corrective action, thereby minimizing potential downtime and maintaining service continuity.
Network scanning is vital for assessing the health of any infrastructure. With Uptime Kuma in place, organizations can effectively monitor their networks, ensuring that all services are operational and promptly addressing any anomalies. Ultimately, Uptime Kuma serves as a crucial tool for maintaining the resilience and reliability of digital assets in an increasingly interconnected world.
Prerequisites for Installation
Before embarking on the installation of Uptime Kuma for network scanning, it is vital to assess the prerequisites to ensure a smooth setup and operation. This section outlines the necessary hardware requirements, software dependencies, and available installation platforms, such as Docker or direct installation on a server.
Firstly, the hardware specifications play a crucial role in the effective performance of Uptime Kuma. At a minimum, the system should have a processor capable of handling multiple threads, accompanied by at least 2 GB of RAM. While Uptime Kuma can operate under lower specifications, optimal results are achieved with 4 GB of RAM or more, especially for environments with extensive monitoring requirements. Additionally, having sufficient disk space is essential, with a recommended allocation of at least 1 GB, as this allows for logging and storing monitoring data without performance degradation.
Secondly, the software dependencies must be properly configured. Uptime Kuma primarily operates using Node.js and MongoDB. Therefore, installing the latest stable versions of Node.js is critical, as it provides the runtime environment necessary for the application. Furthermore, the inclusion of MongoDB facilitates effective data storage and retrieval. It is recommended to consult the official documentation for any specific version requirements and compatibility checks.
In terms of installation platforms, users have the option to utilize Docker, which provides an isolated environment to run Uptime Kuma without affecting other system applications. This is often the preferred method for users who wish to maintain a clean setup. Alternatively, direct installation on a server can be performed, enabling customization tailored to specific operational needs. Ensure that the server environment is appropriately configured to accommodate the required dependencies and provides the necessary access and permissions for seamless functionality.
Step-by-Step Installation Process
Installing Uptime Kuma can be a straightforward process whether you choose to use Docker or opt for a manual installation. Below, we provide a detailed step-by-step guide to assist you in setting up Uptime Kuma for network monitoring effectively.
Installation via Docker:
1. Prerequisites: Ensure you have Docker installed on your machine. You can download it from the official Docker website.
2. Pull the Uptime Kuma Image: Open your terminal and run the following command:
docker pull louislam/uptime-kuma
3. Run the Docker Container: After pulling the image, you will run a container using the command below:
docker run -d -p 3001:3001 --restart=always -v uptime-kuma:/app/data louislam/uptime-kuma
This command sets the container to run in detached mode, mapping port 3001, and saving the data persistently.
Manual Installation:
1. Prerequisites: Ensure that Node.js (version 14 or later) and Git are installed on your server.
2. Clone the Repository: Open your terminal and execute the command:
git clone https://github.com/louislam/uptime-kuma.git
3. Navigate to the Directory:
cd uptime-kuma
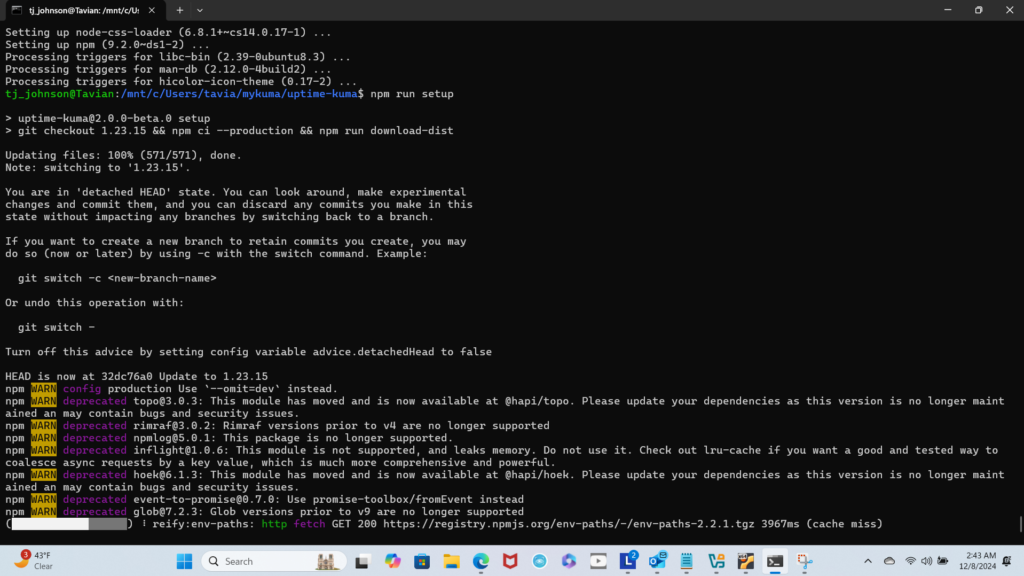
4. Install Dependencies: This is done by running:
npm install
5. Start the Application: Finally, start the Uptime Kuma service using:
npm run start
Regardless of the installation method chosen, after completing these steps, you can access Uptime Kuma by navigating to http://localhost:3001 in your web browser. Here, you can configure your network monitoring settings and manage your uptime checks seamlessly.
Configuring Uptime Kuma for Effective Network Scanning
After successfully installing Uptime Kuma, the next crucial step is configuring the application for optimal network scanning. The first part of this configuration involves setting up monitoring instances. To achieve this, navigate to the dashboard where you will find options to add new monitoring instances. It is advisable to define a clear naming convention for your instances to easily identify them in the future, especially if you are monitoring multiple services or servers. Various types of monitoring options are available, including HTTP(s), TCP, ICMP ping, and more, depending on your specific needs.
Next, customizing alert settings is critical for effective monitoring. Within Uptime Kuma, you can configure how you receive alerts concerning service downtimes or performance issues. Choose preferred notification channels, such as email, Slack, or SMS, to ensure prompt action can be taken when needed. To enhance responsiveness to incidents, it is recommended to set up multiple notification channels, fostering a redundancy in communication.
When it comes to monitoring frequency, best practices suggest not to set it too frequently to avoid unnecessary load on your network resources. A good starting point is monitoring every 5 to 10 minutes, but this can vary based on criticality and expected traffic patterns. Additionally, when dealing with downtime, it is prudent to implement a grace period; this allows momentary outages that may be expected during maintenance work to not trigger unnecessary alerts.
Lastly, consider integrating third-party tools and services, such as Grafana for analytics or webhook services for automation. These integrations can enhance the overall functionality of Uptime Kuma, making it a more robust solution for network monitoring. Overall, proper configuration of Uptime Kuma will significantly maximize its effectiveness in monitoring and maintaining the health of your network infrastructure.